jueves, 25 de abril de 2013

Eye tracking y usabilidad en TV conectada (making off)

Por Mari-Carmen Marcos y Verónica Mansilla
La televisión conectada utiliza la señal de televisión digital terrestre (TDT o DVB-t, digital video broadcasting-terrestrial) y al mismo tiempo está conectada a Internet, de manera que a los contenidos televisivos se les añaden servicios de la red como la televisión a la carta (video on demand, VOD), aplicaciones de redes sociales, acceso a Youtube y a navegador web, etc. Al tratarse de una tecnología reciente, no existe aún un consenso en el diseño de las interfaces de sus menús, así que cada fabricante y cada cadena llegan a una solución, y por lo que se ha visto con poca coincidencia entre sí.
En 2011, un convenio de la Universitat Pompeu Fabra con las empresas Lavinia Interactiva, Televisió de Catalunya y Havas Media hizo posible el estudio que ahora presentamos. Cada partner se ocupaba de una parte del trabajo, concretamente en la UPF teníamos el objetivo de detectar problemas de usabilidad en televisiones conectadas comercializadas en ese momento. Se trataba de un estudio pionero por el objeto de estudio en sí, pero sobre todo por la posibilidad de aplicar la técnica de eye tracking sobre estas televisiones tan recientes.
Los dispositivos que se decidió testear fueron un televisor Sony Bravia, una caja TDT Engel que utiliza el sistema HBB-TV, futuro estándar de TV conectada en Europa, una caja TDT Blu:sens, y una consola de juegos PlayStation3; los cuatro tienen en común el acceso a contenidos de televisión a la carta, y todos salvo la consola tienen también señal de televisión.
Se contó con 70 participantes: 50 para un primer test de usabilidad (sin eye tracker), con la técnica de think aloud, que permitió detectar errores de usabilidad en las interfaces de esos televisores; y 20 más para completar el estudio con un test que utilizó eye tracking y que hizo posible responder algunas cuestiones que el test previo no podía resolver.
Los usuarios realizaron varias tareas en cada dispositivo. Tras unos minutos de navegación libre por los menús para familiarizarse con el equipo y con el mando a distancia, se les presentaban las tareas. Una persona moderaba el test, mientras otra tomaba notas de lo que ocurría.
La sala de testeo iba a ser en origen un plató de televisión de la universidad. Allí dispondríamos de un escenario que ambientaría un salón de casa, con su mobiliario, para que el usuario tuviera una experiencia más parecida a la que puede tener en su casa, aun siendo un laboratorio. El problema que se detectó –y por suerte se detectó antes de tener el escenario montado- es que el campus no cuenta  con antena aérea de TV, sino que usa televisión por IP, por tanto teníamos que instalar una antena en la zona donde se fuera a testear. Dado que el plató está en un sótano y no puede llegar la señal de la antena, ese laboratorio no era viable. Un asunto que en principio era trivial nos llevó varias sesiones hasta resolver dónde instalar la sala de testeo.
Después de muchas pruebas, una evaluación heurística y varios pilotos, comenzamos los tests con los usuarios. En el primer test, sin eye tracker, cada usuario usó sólo un modelo de televisión. Las tareas consistían en localizar la programación de una cadena, encontrar un programa en la TV a la carta, hacer una búsqueda en la web y ver un vídeo en Youtube, en caso de que el sistema dispusiera de esas funcionalidades. En este test se detectaron bastantes problemas, sobre todo relacionados con falta de comprensión de las opciones de los menús de navegación y con la complejidad de los iconos de los mandos a distancia, pero también con la frustración al encontrar que estos televisores no cumplen sus expectativas: la carga es lenta, no están todas las aplicaciones que les gustaría, la navegación es críptica, etc.
La tarea que presentó con diferencia más dificultades y ratios de éxito más bajas fue el uso de la TV a la carta. El motivo principal es que la forma de identificar este servicio no era intuitiva: en unos casos estos canales estaban en el menú “TV” en el mismo grupo que las radios y Youtube, en otros bajo el menú “videos” y en otros bajo “internet”. El caso más llamativo fue el de la caja Engel, que no disponía de una opción de acceso a la TV a la carta por navegación, sino que para acceder a este servicio es necesario que el usuario entre al canal correspondiente por TDT, y una vez ahí aparece un mensaje en pantalla indicando qué tecla del mando a distancia tiene que pulsar para entrar en contenidos bajo demanda. La mayoría de los usuarios no conseguían realizar esta tarea, por lo que se planteó repetirla y grabarla en un test con eye tracker para determinar el motivo de que no lograran acceder al servicio.

 
Figura 1. Proceso de calibración de Tobii Glasses

Este segundo test, realizado con 20 usuarios distintos a los anteriores, se realizo con Tobii Glasses (Figura 1). Se centró  en la tarea de TV a la carta y cada usuario realizó la tarea en los cuatro dispositivos. Se quería saber cuántos usuarios veían el mensaje en pantalla, y de éstos cuántos lo entendían. La muestra se redujo a 14 usuarios por diversos problemas técnicos de la propia grabación, el más importante fue que los rayos infrarrojos de los mandos a distancia interferían con los rayos infrarrojos del eye tracker.
El análisis de los datos presentó varias dificultades. Por un lado, no se habían previsto algunas necesidades para trabajar con ficheros de vídeo tan pesados, como la compra de un disco externo de gran capacidad, mas memoria RAM para el ordenador que computaba los datos, o una tarjeta gráfica dedicada. Por otro lado, el marcado de los vídeos se tenía que realizar manualmente: detectar en qué momento se cargaba el mensaje de aviso en pantalla y en qué momento desaparecía; considerando que un mismo usuario podía llegar varias veces a esa pantalla (¡un usuario llegó a verla 7 veces!), el marcado fue un trabajo minucioso que se hizo para las 45 veces en que apareció el mensaje.
Los resultados que se obtuvieron fueron muy interesantes: sólo 4 usuarios fijaron su mirada en el mensaje que daba la interfaz para acceder a la TV a la carta, y de estos 4 sólo uno lo comprendió y pulsó la tecla del mando que este mensaje indicaba (Figura 2).
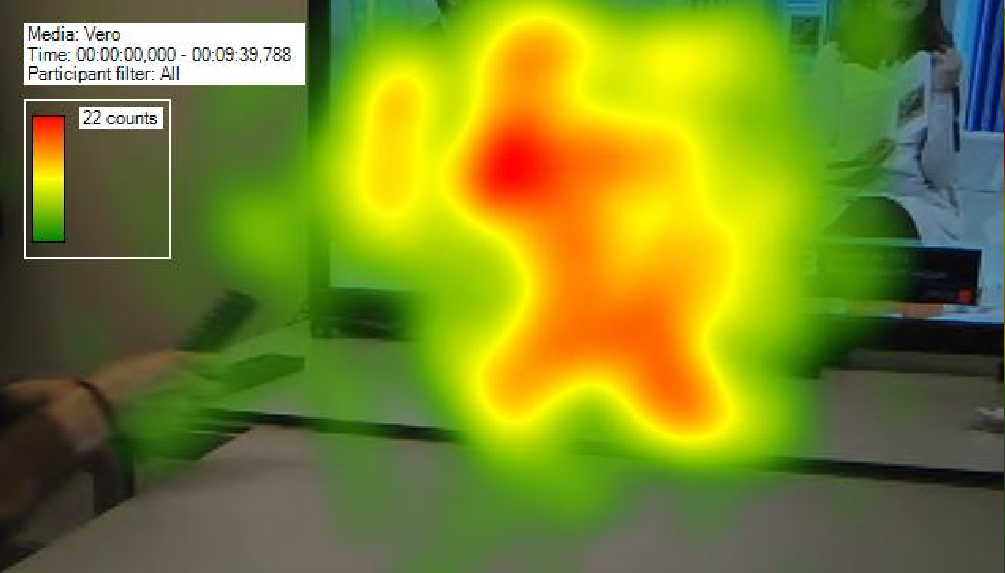
Figura 2. Mapa de calor realizado a partir de las fijaciones de los 14 usuarios que vieron esta interfaz. Este mapa muestra el promedio de tiempo que los usuarios fijan su mirada en cada zona de la pantalla en relación al tiempo total que permanecen en ella. El mensaje (esquina inferior derecha) apenas registra fijaciones

De este estudio sacamos varios aprendizajes, por un lado relativos a los problemas de usabilidad presentes en las interfaces de las TV conectadas que se testearon, y por otro lado relacionados con el uso de eye tracking para testeo de vídeo.

El estudio se puede leer con más detalle en:

Agradecimientos
Esta investigación no hubiera sido posible sin Javier Díaz, David Hernández y Jaume Ponsa, que ayudaron en las sesiones de testeo y en la evaluación heurística. Y por supuesto, nuestro agradecimiento a los usuarios que participaron en el estudio.

lunes, 3 de septiembre de 2012

Reading on paper and reading on the screen

Although we don't wonder nowadays so much about differences between reading on paper or on screen, it is still interesting to see back to some studies to have a global view of visual user behavior.

The paper "An Eye Tracking Study on Text Customization for User Performance and Preference" by Luz Rello and myself (Mari-Carmen Marcos), that will be presented at LA-Web 2012 Conference, presents a user study which compares reading performance versus user preference in customization of the text. We study the following parameters: grey scales for the font and the background, colors combinations, font size, column width and spacing of characters, lines and paragraphs. We used eye tracking to measure the reading performance of 92 participants, and questionnaires to collect their preferences. The study shows correlations on larger contrast and sizes, but there is no concluding evidence for the other parameters. Based on our results, we propose a set of text customization guidelines for reading text on screen combining the results of both kind of data.

In the paper we collect some interesting previous work with empiric studies about readability on screen and printed format. They are mainly focused on layout and typography. The first studies (from 1929 to 1955) on printed format took in consideration the following variables: font size,, column width, font color, space between lines and font style. According to these studies, font type does not affect readability. These results were later confirmed using eye tracking.

We found that font size, font type and paragraph length were the most frequently studied variables concerning readability, but there is not a full agreement between the findings. Font sizes (12 or 14 points depending on the experiment) showed better performances in relation to smaller font sizes (8 and 10 points). Moreover, the largest sizes were also preferred in the surveys. Serif types performed better than sans serif types, however the users revealed to prefer sans serif types.
The performance on reading seems to be better for short lines -around 55, but it depends on the user goal, if they only
need to scan a document, long lines show more efficiency. There is less amount of related work taking into consideration specifically font and background colors and space between lines. Users prefer strong contrasts as well as moderate italics, regular fonts and just one color instead of four or six on a website.
For more information about eye tracking studies on reading for UX practitioners I recommend Jacob Nielsen's blog, and his book with Kara Pernice, Eyetracking web usability.

You might have listen about the F-shaped pattern (J. Nielsen 2006) and the golden triangle (G. Hotchkiss 2005). Both apply mostly in search engine results pages, but not so much in other websites because of the display and layout.

Also some interesting studies have been done in journalism, like those of Poynter Institute for websites and tablets (2011).

(This post will be updated with more papers in the future)


lunes, 25 de junio de 2012

Social annotation in web search: inattentional blindness

---------------------------------------------------
Aditi Muralidharan; Zoltan Gyongyi; Ed Chi. Social Annotation in Web Search. CHI '12 Proceedings of the 2012 ACM annual conference on Human Factors in Computing Systems, pages 1085-1094
Full paper   Extended abstract 
---------------------------------------------------

Knowing that other researchers are looking for answers to similar questions to ours is a good signal of the interest of the topic. In this case, Aditi Muralidharan, Zoltan Gyongyi, and Ed Chi have done two studies on social annotation in web search using eye tracking technology. Here, in Barcelona, we have been running related experiments in the last months and arrived to similar conclusions not published so far.

Their study (CHI 2012)


1) 11 users perform several personalized tasks. Half of the results have snippets with social annotations, the other half have not this kind of results. Test is recorded with an eye tracker and the users watch the recording in a retrospective think-aloud (RTA). The conclusion is that most of people did not notice the social annotations, and those who saw them, don't pay too much attention. Why people don't see them? (see the second test)

2) 12 users (all of them know each other) perform several tasks in mock-ups of search engines. Again, half of the results have snippets with social annotations, the other half have not this kind of results. The pages are mock-ups because they have been modified in order to present social annotation with variations: big/small profile picture, above/below snippet, first/second position, long/short snippets. The test were recorded with eye tracker. The conclusion is that when the picture is big and when the social annotation is above the snippet, people notice it. The reason is that users have a pattern of reading in page results and they don't see further than the elements they recognize as useful in a first scan: title and url. So, new elements like social annotations prompt "inattentional blindness" (as Mack, Rock name it). This phenomenon is widely known, you might have seen the video with the gorilla dancing while other people is playing... and nobody notice it.
In a future paper, the authors could do more experiments to know if changing the style of this snippets would make them more visible.

Our study (We wish CHI 2013  :-)  )


Our study have not been published, so I will not write many results here so far. We studied 5 kind of snippets: Google Places, Google +, Google Author, multimedia and reviews. We duplicated each page of results removing in one version this rich snippets. We prepared 10 SERPs (with their 10 duplicated plain snippets pages). 60 users performed the 10 search and they saw 5 pages with rich snippets and 5 pages without the rich version of the snippet. The sessions were recorded with an eye tracker.
The preliminary results show that, in general, it does not exist significant difference (t-test) between the user visual behavior when looking to pages with rich snippets and the similar pages without them.
The metrics that we considered were mainly the fixation duration in the rich snippet (and his equivalent as a plain snippet) and the time to first fixation in the rich snippet (and his equivalent as a plain snippet), as well as the click count.
We hope to share soon the study with the scientific community and with SEO practitioners.
These heat maps show the fixation duration in the SERP with plain snippets and "Google +" snippets in 6th and 2nd position. No differences


And here you are some statistical results for the fixation duration average on the studied snippets on a top position (position 2) and in a bottom position (position 6). No significant differences:


jueves, 21 de junio de 2012

Thinking on buying an eye tracker?

Sometimes other colleagues around the world ask me about which eye tracker could they buy or rent.
My answer is "it depends on the kind of study you plan to run".

There are several firms in the market selling eye tracking devices based on infrared (for serious research I don't trust yet in other technologies based on recording the users' ayes with a webcam). As an infrared-based technology I know Tobii. I have a Tobii T1750, a second-hand one in fact from 2007, that it is not anymore in the market, so I cannot be sure about the newer models to recommend, but here you are some models and the uses that I (and Tobii) recommend for each one:

  • Tobii T60 hz and T120. Useful for research that aim to study the users' behavior on websites, images, and anything that can be showed on the screen. This device brings the infrared on the screen. Useful for usability studies
  • Tobii X60 and X120. Useful for research on screen (external screen) or other devices as mobile phones or tablets if you incorporates a special device for them. It is a great option because is lighter and flexible. If I could buy another one now, this would be my first option.
  • Tobii T60 XL. Similar to T60 but wider. Useful for studies that need a big screen. I don't see the point for usability studies.
  • Tobii Glasses. Necessary if the research is about physical objects (supermarket products, museums, etc.). I used it in a study on Connected TV and video games. It works properly but the resolution is lower than in screen-based eye trackers, and the complexity for the analysis is bigger due to the kind of information: video. It is not convenient for web studies.
 About to make your decision? Don't be on a hurry, it is an expensive device with an expensive software. Take it easy, check Tobii website, compare, and let me know if we can plan a joint research!

miércoles, 4 de enero de 2012

Lecturas "must" sobre Eye tracking aplicado a estudios de usabilidad

Los más teóricos (libros, artículos y tesis doctorales):
  • Jacob, R.; Karn, K. “Eye Tracking in Human-Computer Interaction and Usability Research: Ready to Deliver the Promises (Section Commentary)”. En: Hyona,J.; Radach, R.; Deubel, H. (eds.)The Mind's Eye: Cognitive and Applied Aspects of Eye Movement Research, pp. 573-605, Elsevier Science, http://www.cs.tufts.edu/~jacob/papers/ecem.pdf (2003)
  • Goldberg, J.H.; Wichansky, A.M. Eye tracking in usability evaluation: A Practitioner's Guide. En: Hyona, J., Radach, R., Duebel, H (Eds.). The mind's eye: cognitive and applied aspects of eye movement research. Boston, North-Holland / Elesevier, 2003, 573-605. 
  • Hassan, Y.; Herrero, V. “Eye Tracking en Interacción Persona-Ordenador”. No solo usabilidad http://www.nosolousabilidad.com/articulos/eye-tracking.htm (2007).
  • Nielsen, J.; Pernice, K.  Eyetracking Web Usability. New Riders Press (2009).
  • Duchowski, A. Eye Tracking Methodology. Springer (2009).
  • Nielsen, J.; Pernice, K. Técnicas de Eyetracking para Usabilidad Web. Anaya Multimedia (2010).
  • Drewes, H.  (2010). Eye Gaze Tracking for Human Computer Interaction, http://edoc.ub.uni-muenchen.de/11591/1/Drewes_Heiko.pdf
Estudios de caso:
Reflexiones:
Pautas:
Métricas:

miércoles, 7 de septiembre de 2011

ETRA: Eye Tracking research & Applications (Conference)

Looking for interesting conferences where to submit the next papers I have found an ACM Conference named ETRA. It is not focused on HCI or IR or other topics about which I usually write, but on all the research concerned to the eye tracking technique, applied to any science.

ETRA will be held in March 2012 in Santa Barbara (CA):
http://www.etra2012.org/

The program of the last year conference, that was held in Austin are available at:
http://etra.cs.uta.fi/program.html

Thanks to this last page I have had news of Yvonne Kammerer, a researcher who is working on search. Her publications can be seen at:
http://www.iwm-kmrc.de/www/en/mitarbeiter/ma.html?dispname=Yvonne+Kammerer&uid=ykammerer

This is a list of those which are related to web search:

Kammerer, Y., & Gerjets, P. (2011). Searching and evaluating information on the WWW: Cognitive processes and user support. In K.-P. L. Vu & R. W. Proctor (Eds.), Handbook of human factors in Web design (2nd ed., pp. 283-302). Boca Raton, FL: CRC Press.

Gerjets, P., Kammerer, Y., & Werner, B. (2011). Measuring spontaneous and instructed evaluation processes during web search: Integrating concurrent thinking-aloud protocols and eye-tracking data. Learning and Instruction, 21, 220-231.

Kammerer, Y., & Beinhauer, W. (2010). Gaze-based Web search: The impact of interface design on search result selection. In C. Morimoto & H. Instance (Eds.), Proceedings of the 2010 Symposium on Eye Tracking Research & Applications ETRA ’10 (pp. 191-194). New York, NY: ACM. [pdf at ACM DL]

Kammerer, Y., & Gerjets, P. (2010). How the interface design influences users’ spontaneous trustworthiness evaluations of Web search results: Comparing a list and a grid interface. In C. Morimoto & H. Instance (Eds.), Proceedings of the 2010 Symposium on Eye Tracking Research & Applications ETRA ’10 (pp. 299-306). New York, NY: ACM.
[pdf at ACM DL]

Kammerer, Y., Wollny, E., Gerjets, P., & Scheiter, K. (2009). How authority-related epistemological beliefs and salience of source information influence the evaluation of web search results – An eye tracking study. In N. A. Taatgen, & H. van Rijn (Eds.), Proceedings of the 31st Annual Conference of the Cognitive Science Society (pp. 2158-2163). Austin, TX: Cognitive Science Society.

Kammerer, Y., & Gerjets, P. (2010, May). Objective, subjective, and commercial information: The impact of presentation format on the visual inspection and selection of Web search results. The Scandinavian Workshop on Applied Eye-Tracking (SWAET). Lund, Sweden.

Kammerer, Y., Werner, B., & Gerjets, P. (2008). What evaluation processes are performed during web search? An eye-tracking study. XXIX International Congress of Psychology (ICP). Berlin.


jueves, 28 de julio de 2011

Métricas de usabilidad y UX

Althoug these readings are not exactly for measuring with eye tracking, all of them are focused on measuring usability and user experience:
Here you are a list of reading about SUS:
Five second tests:

(To be continued...)